

Intro
This article explains how to add a KPI component from a template and configure a metric with an aggregation, date range, filter, and formatting. To group and aggregate data in other app components, see Group and Aggregate Data in App Components.Required Grants
To access app components, the following grants must be enabled for your role:- Edit App (App Studio) — Allows you to edit App Studio pages within App Studio.
- Edit Cards — Allows you to edit Cards in Domo.
Add a KPI Component
A KPI component displays one or more headline metrics—such as Total Revenue or Average Deal Size—computed directly from a DataSet column. You add a KPI component from a template, then power and configure each of its Number widgets.-
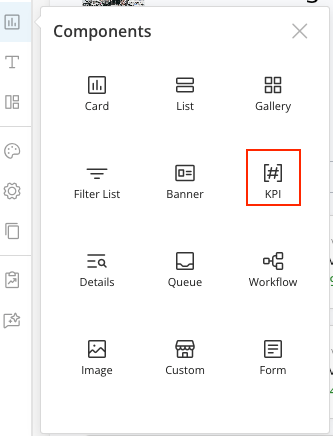
In the App Studio app editor, select Components in the left pane.
-
Select the KPI template.
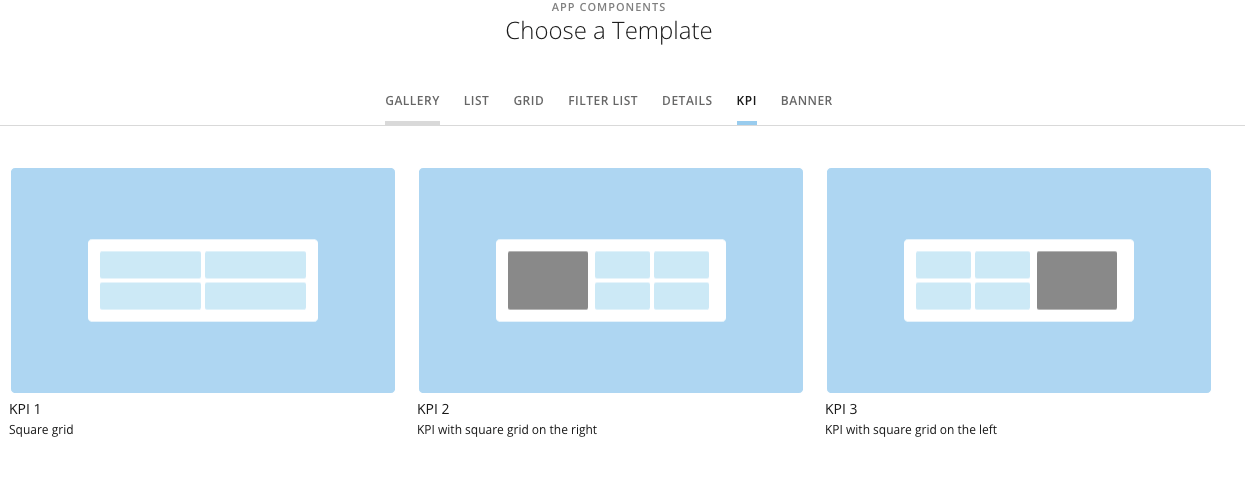
- Select one of the three KPI templates.
- Select the power icon and choose a DataSet to power the component. Each template comes with Number widgets already in place, ready to point at your columns.
Configure a KPI Metric
Each metric is a Number widget that you configure in the right pane—column, aggregation, filter, and formatting. Configure each widget independently.-
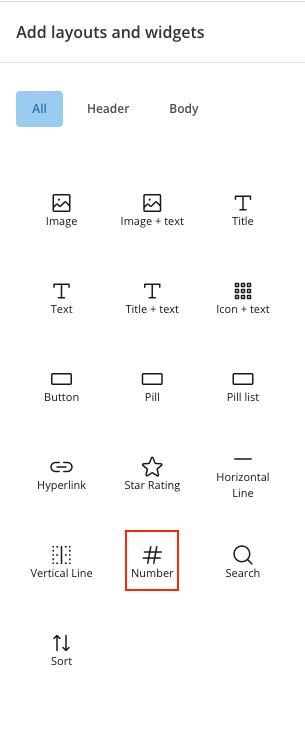
Select a Number widget in the widgets pane.
The widget’s options open in the right pane.
-
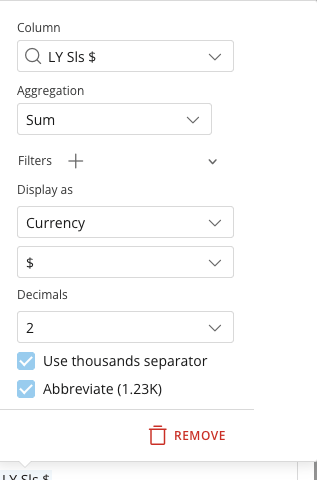
Select the Column that powers the metric, then choose the aggregation in the popover.
-
Select an Aggregation:
-
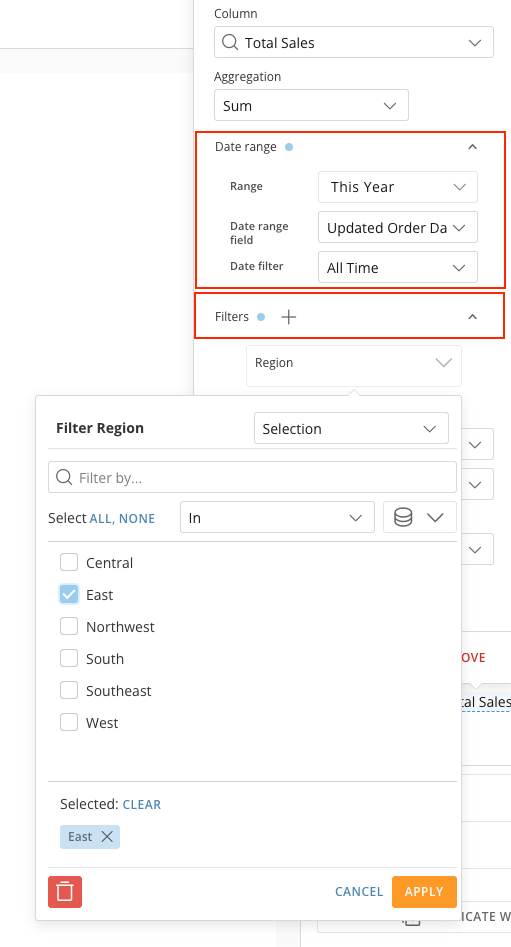
(Optional) Filter the metric:
- By date: select a date range, such as this week or this year.
- By column: add a column filter, such as Region is North.
- Format the value. Set the display type (Currency, Number, or Percent), decimal places, thousands separator, and abbreviation (for example, 1.23K or 8.10B).
-
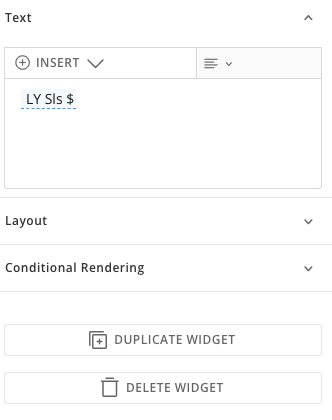
(Optional) To reuse a metric, duplicate its widget from the right pane, then change the setting you want, such as the filter value.
- Save your app component.
Note: Each widget’s filter is independent, so the same measure can appear several ways in one component from a single DataSet—for example, one widget per region.
FAQ
Do I need a Beast Mode calculation or a pre-aggregated DataSet to show a total?
Do I need a Beast Mode calculation or a pre-aggregated DataSet to show a total?
No. A KPI component aggregates a column at query time, so you can display a total, average, or count without building a Beast Mode calculation or a separate aggregated DataSet.
Do data permissions apply to aggregated values?
Do data permissions apply to aggregated values?
Yes. Aggregations are computed only over the rows a viewer is permitted to see, so Personalized Data Permissions (PDP) policies apply. Two viewers with different PDP scopes can see different totals from the same metric definition. Learn how to apply a PDP policy to a DataSet in Personalized Data Permissions (PDP).
What happens when a metric returns no rows?
What happens when a metric returns no rows?
The metric displays a defined empty state rather than an error. Adjust the aggregation, filter, or date range to return data.
Can I color a KPI value based on its number?
Can I color a KPI value based on its number?
Yes. Apply a rule to the value with conditional formatting. See Apply Conditional Formatting and Conditional Rendering in App Components.