Property
Description
Example
General > Style
Determines the style for a Stream chart, either Curved (default) or Flat . The example shows a Stream chart that uses the "Flat" style.

 Whereas the next example shows the same chart with series data applied:
 ## Powering Stream Charts
Stream charts require two columns or rows of data from your DataSet—a category column or row containing the names of each stage, and a value column or row containing the corresponding values for each stage. You can also add a column containing series data if you want. For information about value, category, and series data, see [Understanding Chart Data](/docs/s/article/360043428693 "Understanding Chart Data").
In the Analyzer, you choose the columns containing the data for your Stream chart. For more information about choosing data columns, see [Applying DataSet Columns to Your Chart](/docs/s/article/360043428713 "Applying DataSet Columns to Your Chart").
For more information about formatting charts in the Analyzer, see [Visualization Card Building Part 2: The Analyzer](/docs/s/topic/0TO5w000000ZaoUGAS "KPI Card Building Part 2: The Analyzer").
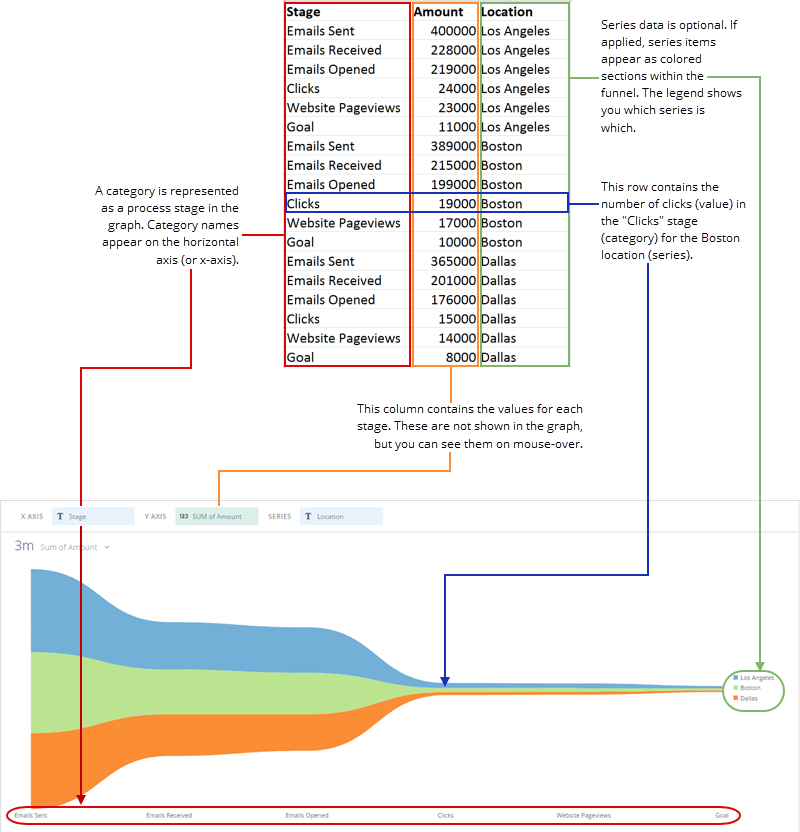
The following graphic shows you how the data from the category, value, and series columns in a typical column-based spreadsheet is converted into a Stream chart:
## Powering Stream Charts
Stream charts require two columns or rows of data from your DataSet—a category column or row containing the names of each stage, and a value column or row containing the corresponding values for each stage. You can also add a column containing series data if you want. For information about value, category, and series data, see [Understanding Chart Data](/docs/s/article/360043428693 "Understanding Chart Data").
In the Analyzer, you choose the columns containing the data for your Stream chart. For more information about choosing data columns, see [Applying DataSet Columns to Your Chart](/docs/s/article/360043428713 "Applying DataSet Columns to Your Chart").
For more information about formatting charts in the Analyzer, see [Visualization Card Building Part 2: The Analyzer](/docs/s/topic/0TO5w000000ZaoUGAS "KPI Card Building Part 2: The Analyzer").
The following graphic shows you how the data from the category, value, and series columns in a typical column-based spreadsheet is converted into a Stream chart:
 ## Customizing Stream Charts
You can customize the appearance of a Funnel chart by editing its **Chart Properties**. For information about all chart properties, see [Chart Properties](/docs/s/topic/0TO5w000000ZaodGAC "Chart Properties").
## Customizing Stream Charts
You can customize the appearance of a Funnel chart by editing its **Chart Properties**. For information about all chart properties, see [Chart Properties](/docs/s/topic/0TO5w000000ZaodGAC "Chart Properties").
Property | Description | Example |
|---|---|---|
General > Style | Determines the style for a Stream chart, either Curved (default) or Flat . The example shows a Stream chart that uses the "Flat" style. | |